

Geospatial Portfolio
Nadia Sharif
Building spatial applications that turn location data into better decisions.
Geospatial Analyst | GIS Developer | WebGIS | Digital Twins | Spatial Analytics
I'm a Geospatial Analyst and GIS Developer with a Master's in Geospatial Science from RMIT University and previous experience developing enterprise GIS applications. My work combines spatial analysis, Python automation and web GIS to solve infrastructure, environmental and urban planning problems.
This portfolio showcases selected projects demonstrating spatial analytics, digital twins, remote sensing, machine learning and full-stack geospatial application development.
-
Spatial Analytics
-
Web GIS
-
Digital Twins
-
Python Automation
-
Remote Sensing
-
Machine Learning
Featured Projects
Case Study
Overview
Developed a live 3D digital twin of Melbourne's metropolitan rail network that visualises train locations, service disruptions and planned works using real-time GTFS feeds.
The Challenge
Public transport data is often spread across multiple APIs and is difficult to visualise in a way that supports real-time monitoring and operational awareness.
The Solution
Designed and developed a three-tier web GIS application that integrates GTFS-Realtime feeds with CesiumJS to display live train movements, service disruptions and trip updates on an interactive 3D map.
Technologies
Node.js
Express.js
CesiumJS
GTFS Realtime API
GeoJSON
JavaScript
GitHub Pages
Vercel
Key Skills Demonstrated
Digital Twin Development
Web GIS
API Integration
Real-time Data Processing
Cloud Deployment
Full-stack JavaScript
Outcome
✔ Live train positions updated in real time
✔ Interactive 3D visualisation of Melbourne's rail network
✔ Integrated disruptions, planned works and trip updates into a single operational dashboard
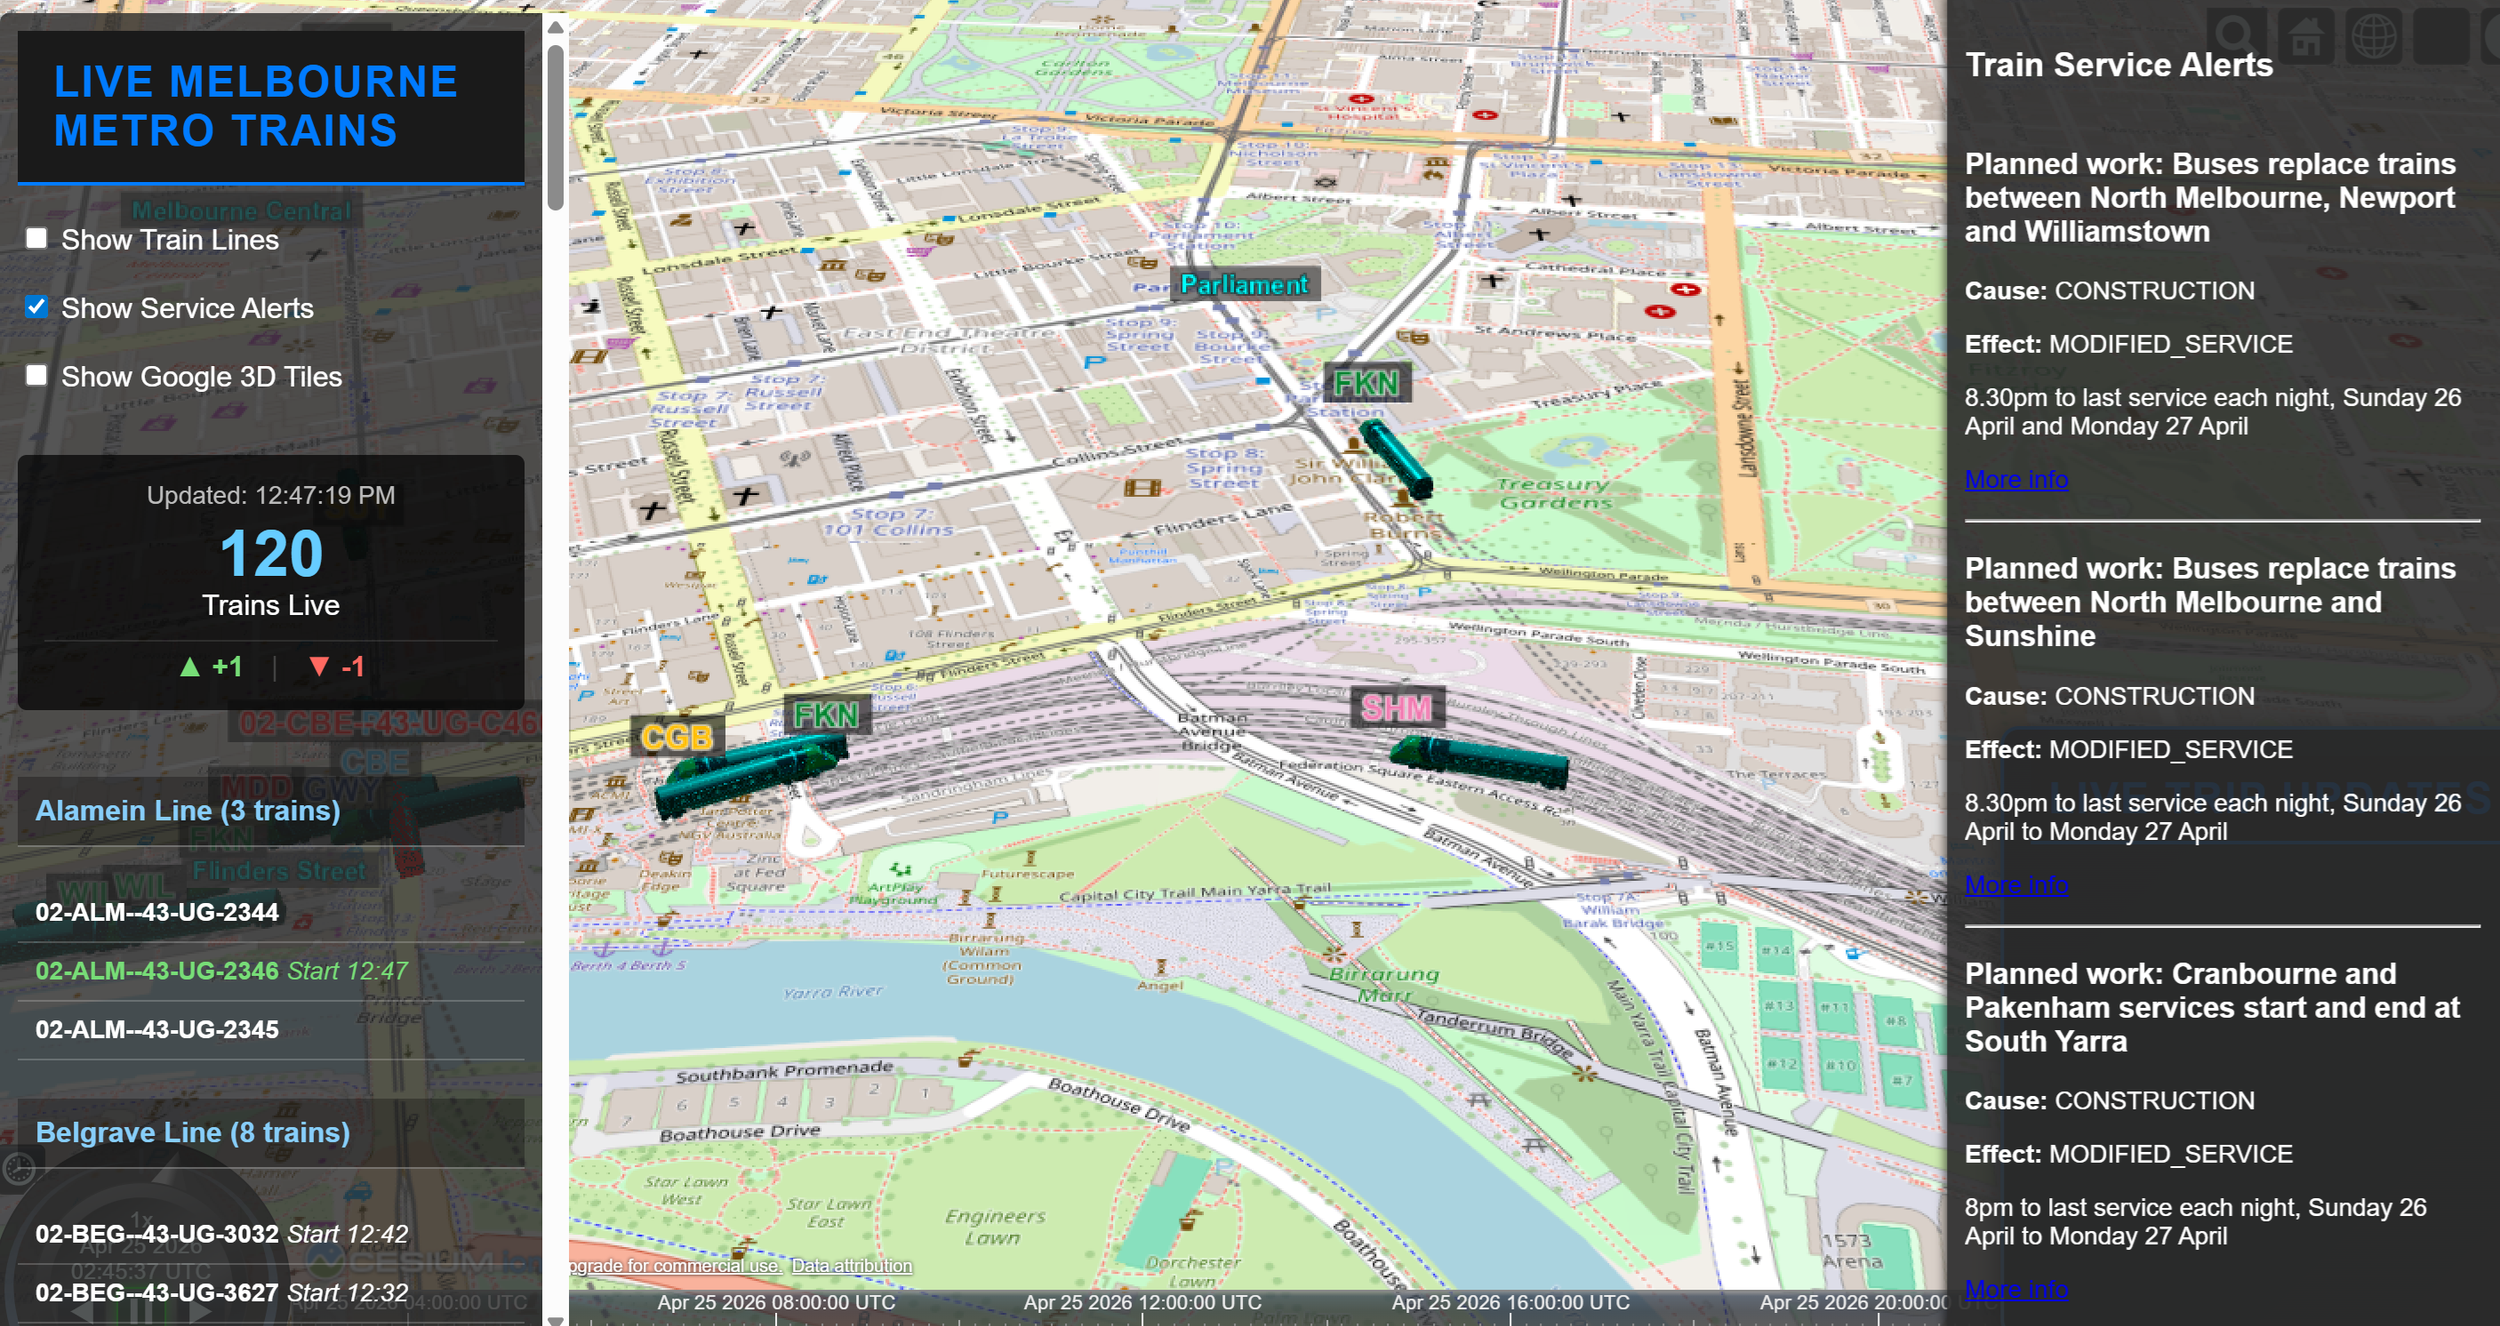
Melbourne Metro Digital Twin
20- Minute Neighbourhood Explorer
Case Study
Overview
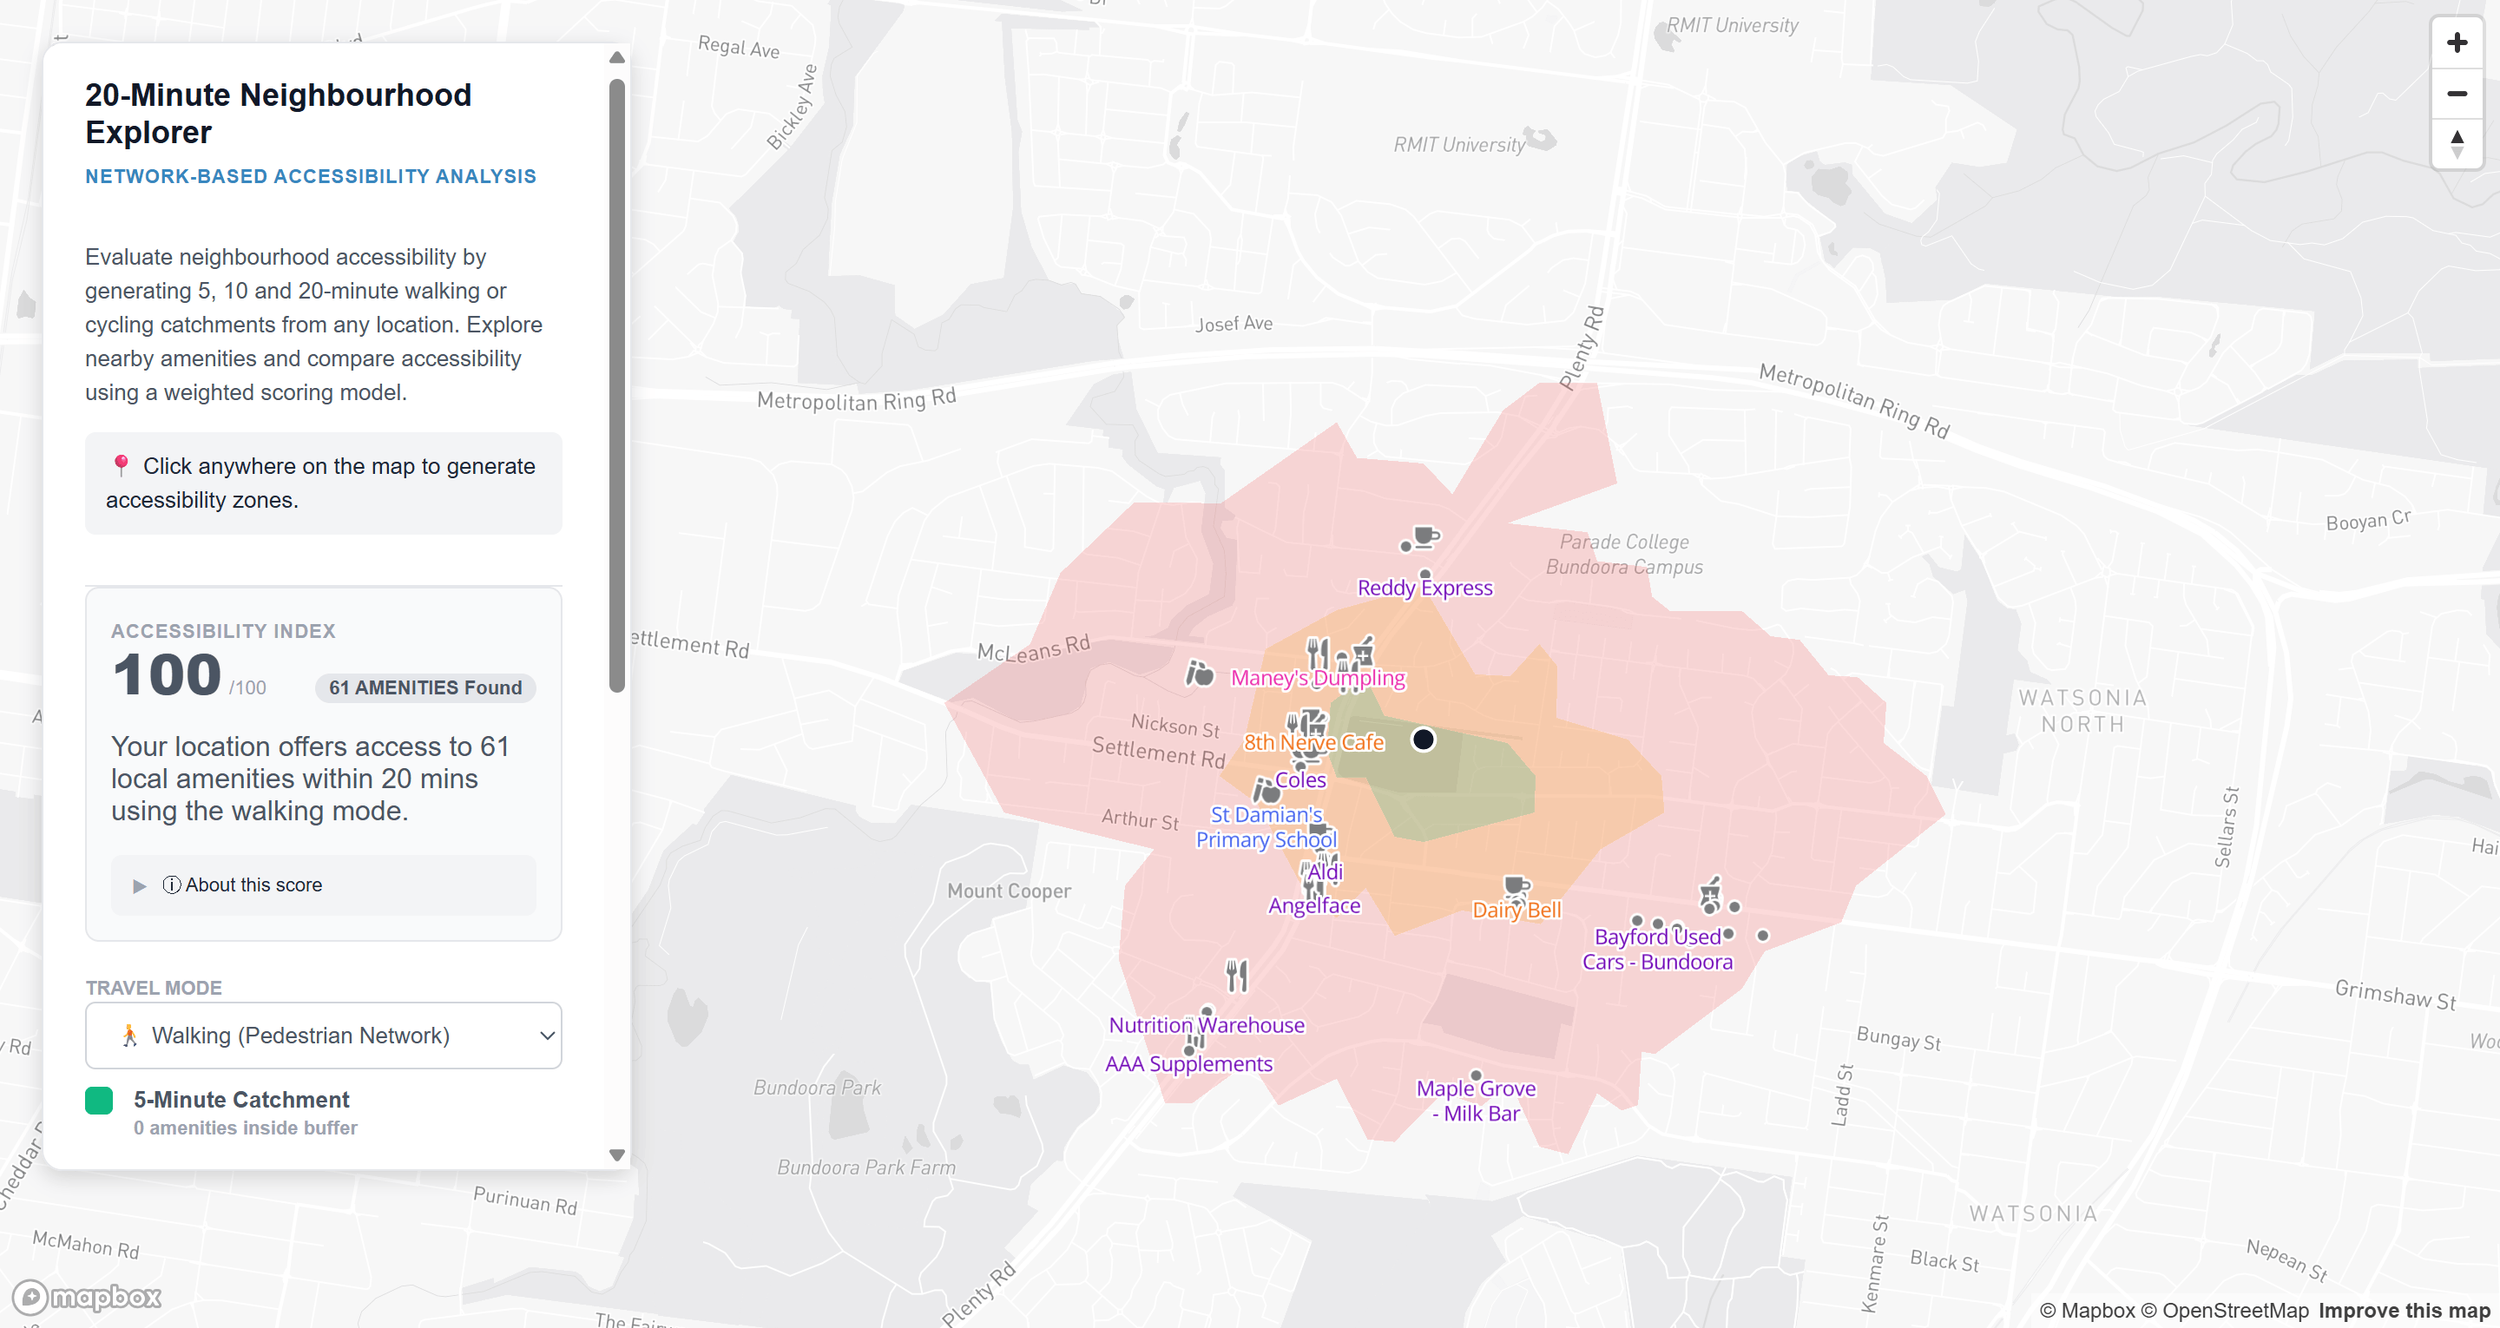
An interactive Web GIS application inspired by the 20-Minute Neighbourhood concept from Plan Melbourne. The application evaluates how accessible a location is by generating 5, 10 and 20-minute walking or cycling isochrones and measuring access to nearby amenities.
Users can click anywhere on the map to generate network-based travel time polygons, view nearby points of interest, and explore an accessibility score based on weighted proximity to essential services. The application combines Mapbox Isochrone APIs, OpenStreetMap data and client-side spatial analysis to provide an interactive decision-support tool for exploring neighbourhood accessibility.
Technologies
Mapbox GL JS
Mapbox Isochrone API
Overpass API
Turf.js
JavaScript
GeoJSON
HTML & CSS
Key Skills Demonstrated
Web GIS Development
Network Analysis
Accessibility Modelling
Client-side Spatial Analysis
API Integration
Urban Analytics
Interactive Mapping
Data Limitations
The application uses the Mapbox routing engine to generate travel-time isochrones and OpenStreetMap (OSM) data for points of interest. While Mapbox generally provides reliable walking and cycling networks, the completeness of OSM amenity data varies by location because it is community-maintained. As a result, accessibility scores should be interpreted as indicative rather than definitive, particularly in areas where OSM coverage is less complete.
Longwood Bushfire Damage Assessment
Case Study
Overview
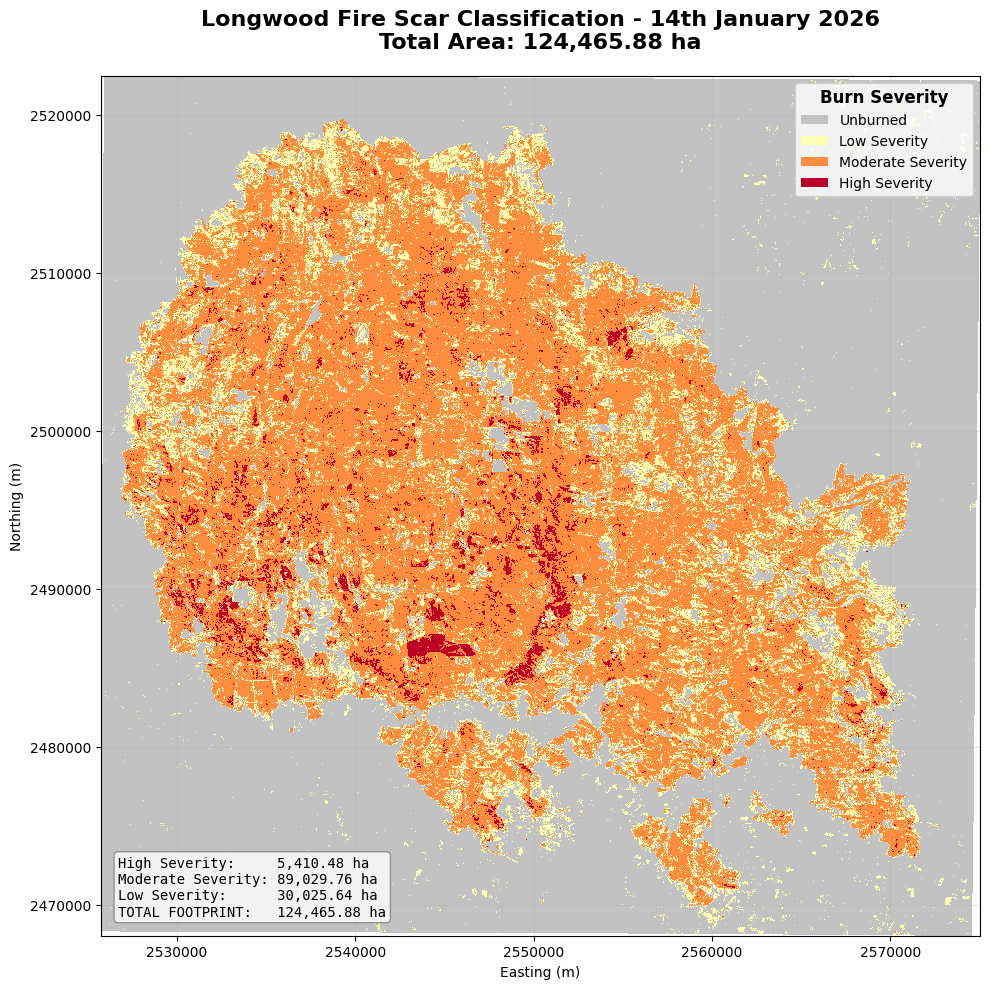
Developed a remote sensing workflow to assess the environmental impact of the Longwood Bushfire by analysing Sentinel-2 satellite imagery and identifying affected properties.
The Challenge
Rapidly identifying bushfire-affected areas and impacted properties is essential for emergency response and environmental recovery, but manual assessment is time-consuming and resource intensive.
The Solution
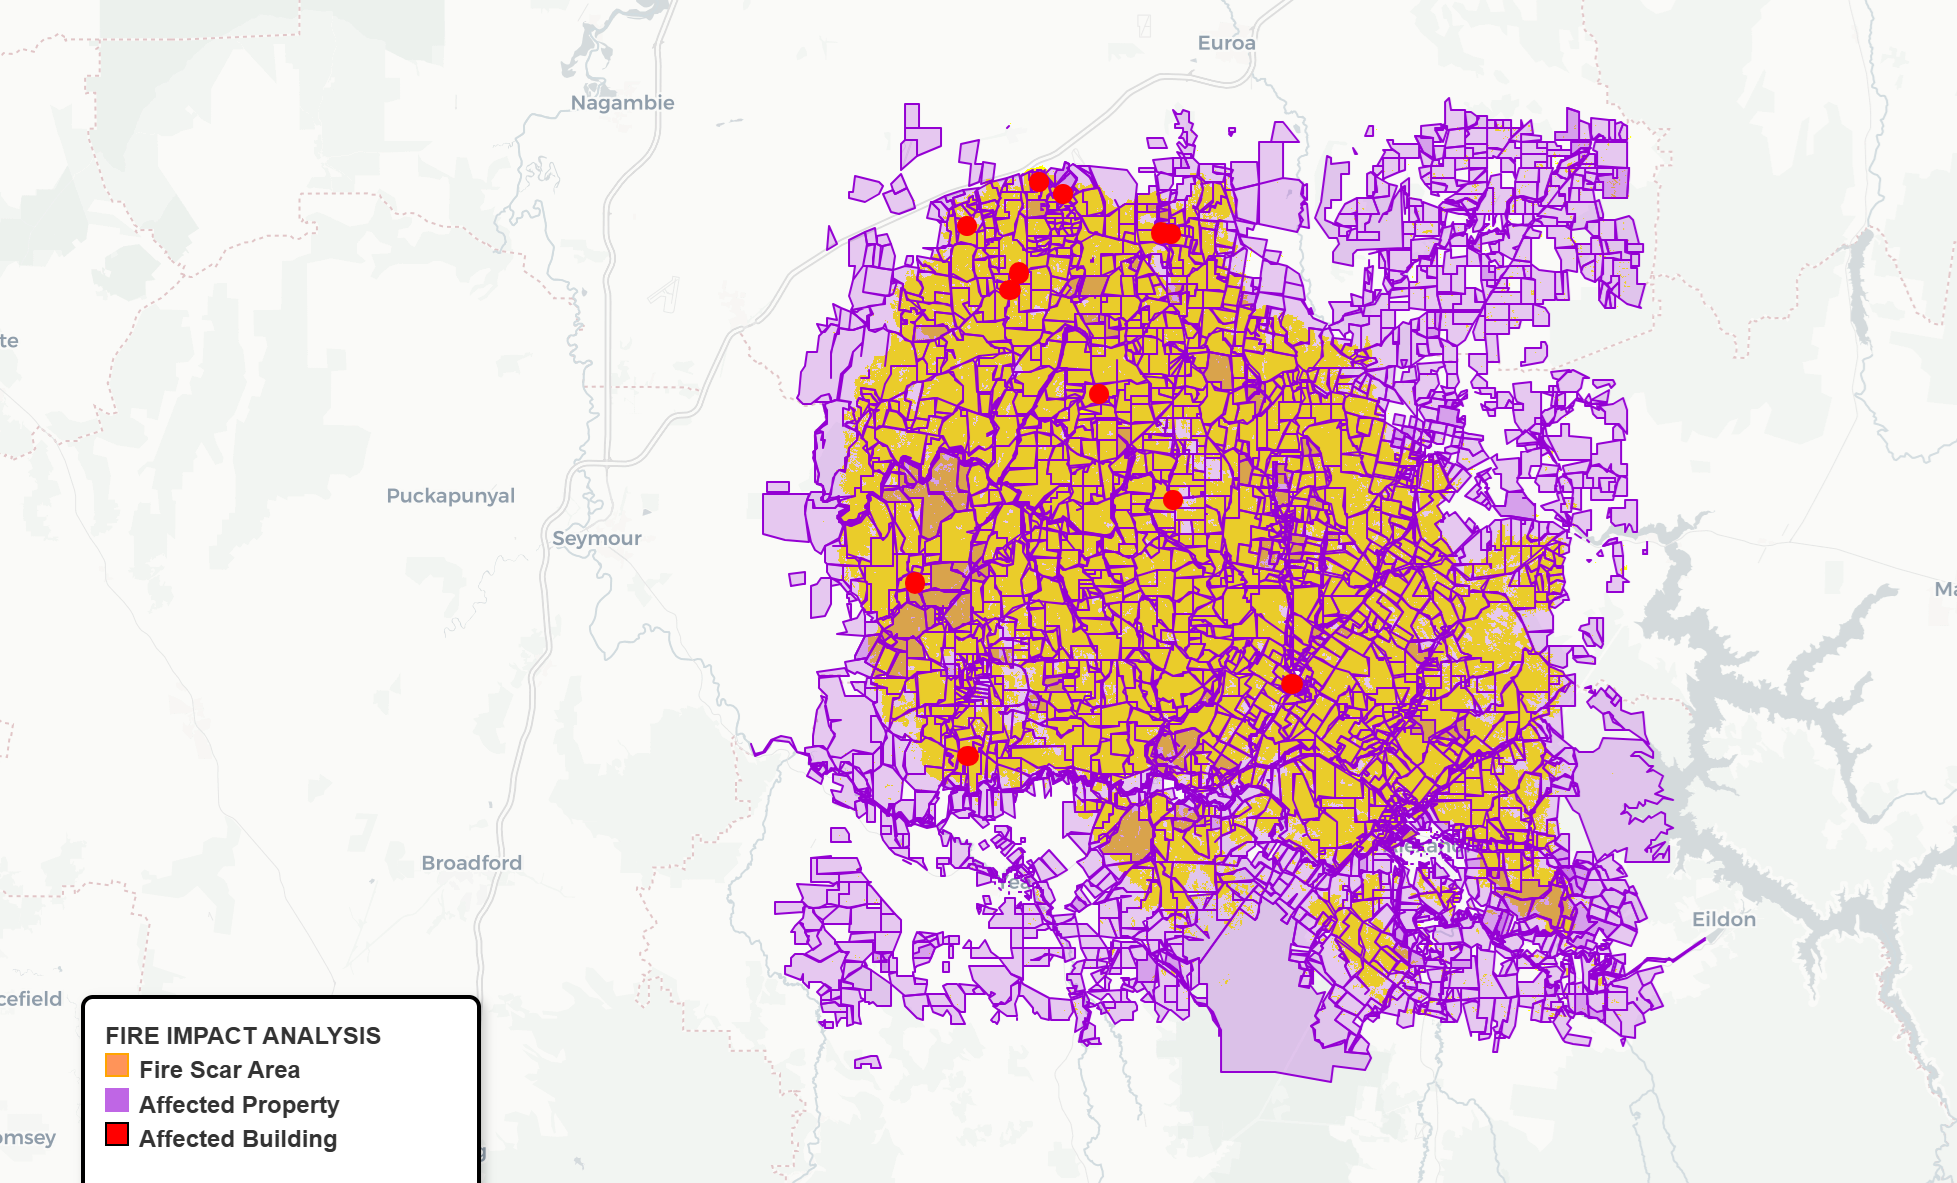
Designed an automated Python workflow to process Sentinel-2 imagery, calculate burn severity indices, perform spatial analysis and visualise affected properties using interactive web maps.
Technologies
Python
GeoPandas
Rasterio
rioxarray
Sentinel-2
Folium
Jupyter Notebook
Key Skills Demonstrated
Remote Sensing
Python Automation
Raster Analysis
Spatial Analysis
Interactive Web Mapping
Environmental GIS
Outcome
✔ Processed satellite imagery to identify burn severity
✔ Mapped affected properties using spatial overlays
✔ Produced interactive maps to support post-fire impact assessment
View the colab notebook here.
View Fire Impact Folium Map here.
View Property Impact Map here.
Urban Heat & Microclimate Analysis

Case Study
Overview
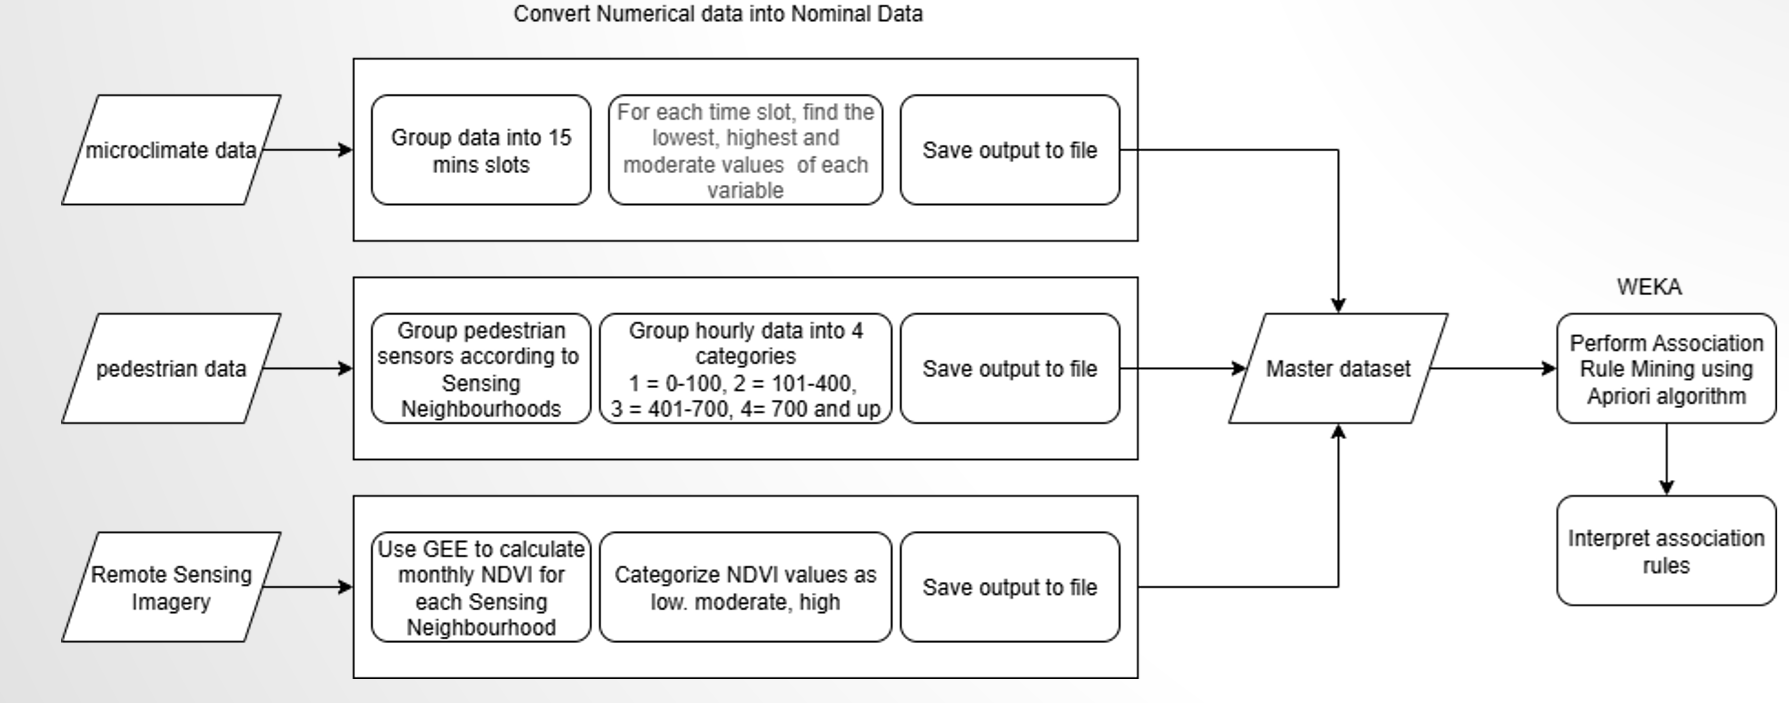
Developed a geospatial machine learning workflow to integrate IoT sensor data, pedestrian activity and satellite-derived vegetation indices into a unified spatial dataset for knowledge discovery. The project demonstrates how GIS and association rule mining can generate evidence-based insights to support urban resilience and environmental policy.
The Challenge
Urban planners collect environmental data from multiple sources, but differences in spatial and temporal resolution make it difficult to combine these datasets into meaningful insights for decision-making.
The Solution
Designed a GIS workflow that normalised and integrated microclimate sensor data, pedestrian counts and Sentinel-2 NDVI imagery into a common spatial framework. Applied Association Rule Mining using WEKA to discover relationships between environmental conditions, vegetation and human activity, then translated the resulting patterns into policy-relevant recommendations for improving urban resilience.
Technologies
ArcGIS Pro
Python
WEKA
Sentinel-2
NDVI
IoT Sensor Data
Spatial Data Integration
Association Rule Mining
Key Skills Demonstrated
Spatial Data Integration
Machine Learning
Environmental GIS
Remote Sensing
Data Preparation
Geospatial Research
Policy Analytics
Outcome
✔ Integrated multiple spatial datasets with differing temporal and spatial resolutions into a unified analytical framework
✔ Generated interpretable association rules linking environmental conditions, vegetation and pedestrian activity
✔ Demonstrated how geospatial machine learning can support evidence-based urban planning and environmental resilience
✔ Research presented at the Global Smart Cities Summit & 4th International Conference on Urban Informatics (Hong Kong, 2025) as an RMIT-sponsored Master's research project
Victoria Business Activity Hotspots

Case Study
Overview
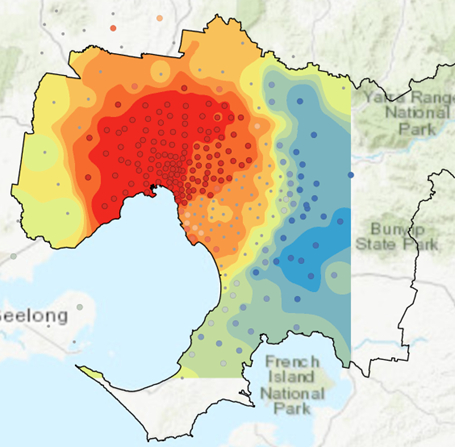
Performed spatial statistical analysis of Victorian business registrations to identify significant clusters of economic activity and regional business growth patterns.
The Challenge
Understanding where business activity is concentrated helps governments and organisations make informed planning and investment decisions.
The Solution
Applied spatial statistical techniques to analyse business registration data, identify statistically significant hotspots and communicate findings through clear thematic maps.
Technologies
ArcGIS Pro
Python
SQL
Moran's I
Getis-Ord Gi*
Spatial Statistics
Key Skills Demonstrated
Spatial Statistics
Hotspot Analysis
SQL
Data Visualisation
Economic Geography
GIS Analytics
Outcome
✔ Identified statistically significant business hotspots across Victoria
✔ Produced publication-quality maps and analytical outputs
✔ Demonstrated the application of spatial statistics for decision support
Additional Projects
Spatial Analysis of Victorian House Price Trends
Case Study
Overview
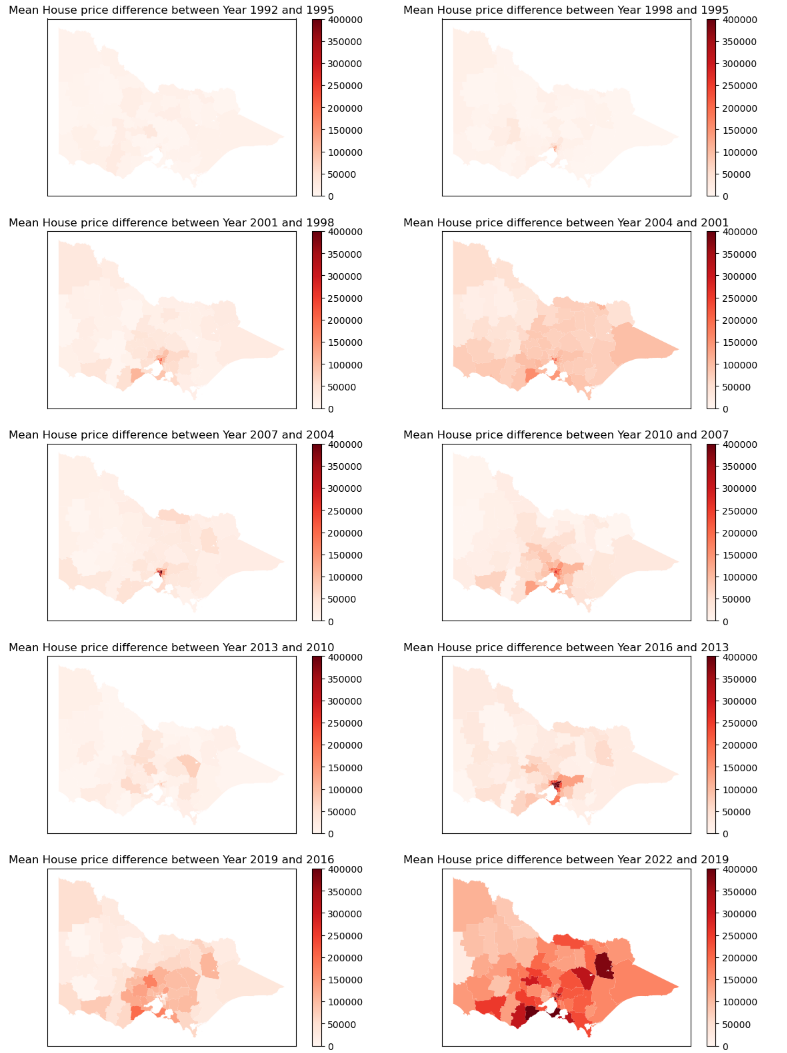
Developed a Python-based geospatial analysis workflow to examine changes in Victorian house prices between 1992 and 2022 by integrating property price data with Local Government Area boundaries.
The Challenge
Understanding long-term property price growth requires combining tabular housing data with administrative boundary datasets to reveal regional patterns and trends.
The Solution
Built a Python workflow that cleaned and standardised property price datasets, joined them with ABS Local Government Area boundaries and generated static and interactive choropleth maps showing house price growth across Victoria.
Technologies
Python
GeoPandas
Pandas
Matplotlib
Folium
Jupyter Notebook
Key Skills Demonstrated
Spatial Data Processing
Data Cleaning
Spatial Joins
Thematic Mapping
Interactive Web Mapping
Exploratory Data Analysis
Outcome
✔ Integrated 30 years of property price data with Victorian LGA boundaries
✔ Visualised regional house price growth using static and interactive maps
✔ Built a reproducible Python workflow for geospatial data analysis

Melbourne 3D Planning Explorer
Case Study
Problem
Planning and development information is difficult to interpret using traditional 2D maps and planning datasets.
Solution
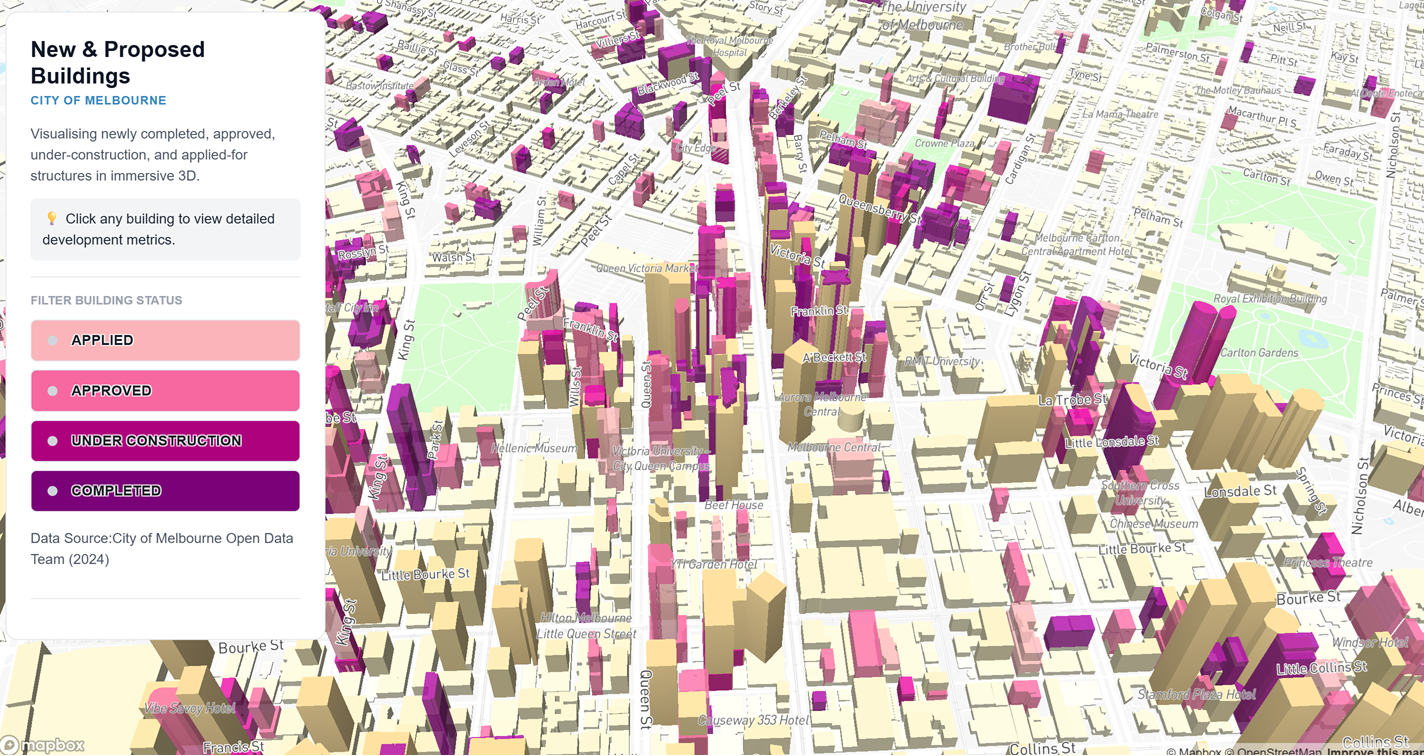
Developed an interactive 3D Web GIS application that visualises newly completed, approved, under-construction and proposed buildings across the City of Melbourne. Users can filter developments by status and access detailed building information through interactive popups using open planning data.
Technologies
Mapbox GL JS
JavaScript
HTML
CSS
GeoJSON
City of Melbourne Open Data
Skills
Web GIS • 3D Visualisation • Interactive Mapping • Spatial Data Integration • Front-end Development